
Dataset Explorer
The Airtrain AI Dataset Explorer lets you explore, visualize, segment, curate, and drill into your datasets.
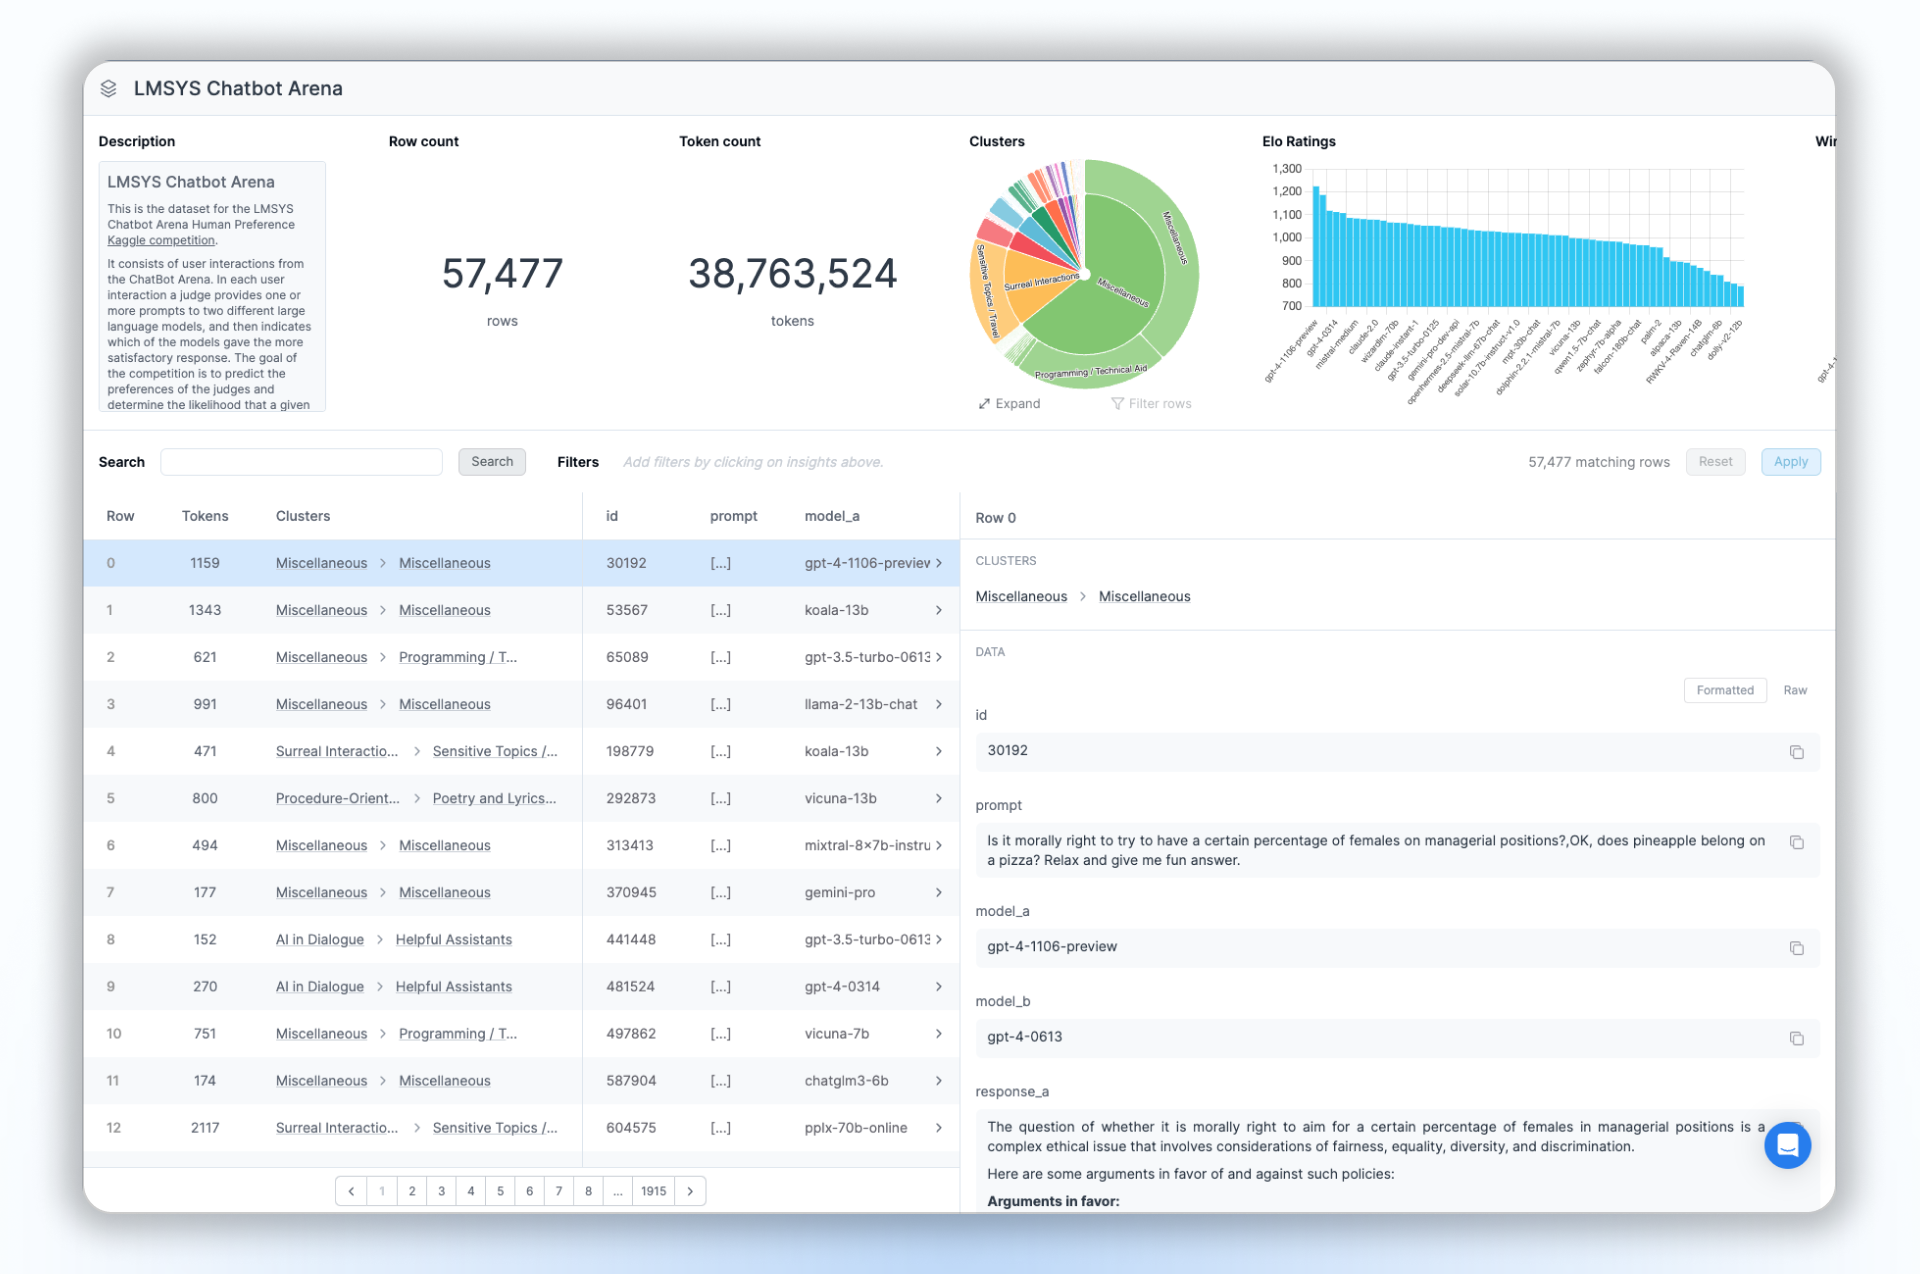
Browsing data
You can easily scroll through the rows of your dataset in the bottom left quadrant of the screen. Flip through pages and select rows of interest.
The select row is displayed in the bottom right quadrant of the screen. There you can inspect the detailed content of the dataset row.
There are two viewing modes:
- Formatted – each value in your row is displayed individually, formatted for markdown. This makes for better readability.
- Raw – the dataset row is displayed as a raw JSON object.
Insights
At the top of the screen, you can visualize Insight Widgets that aggregate metrics and insights across the entire dataset.
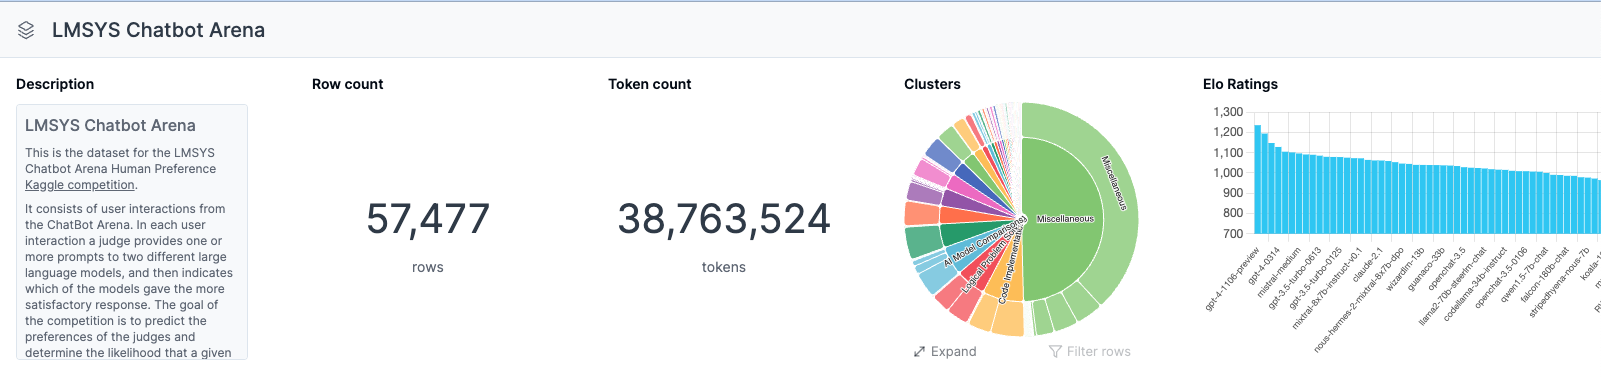
Clusters
Semantic clusters are automatically generated for all datasets. You can explore and drill into clusters by clicking them in the sunburst chart.
Filtering data
Filter by cluster
You can filter the dataset by cluster by selecting a cluster in the sunburst chart and clicking "Filter rows".
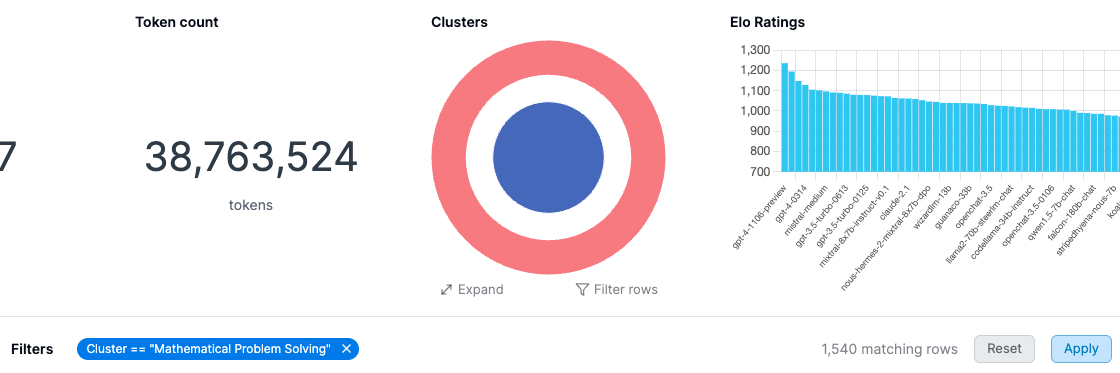
This will add a filter to the Filters list. Then click Apply to launch the filtering.
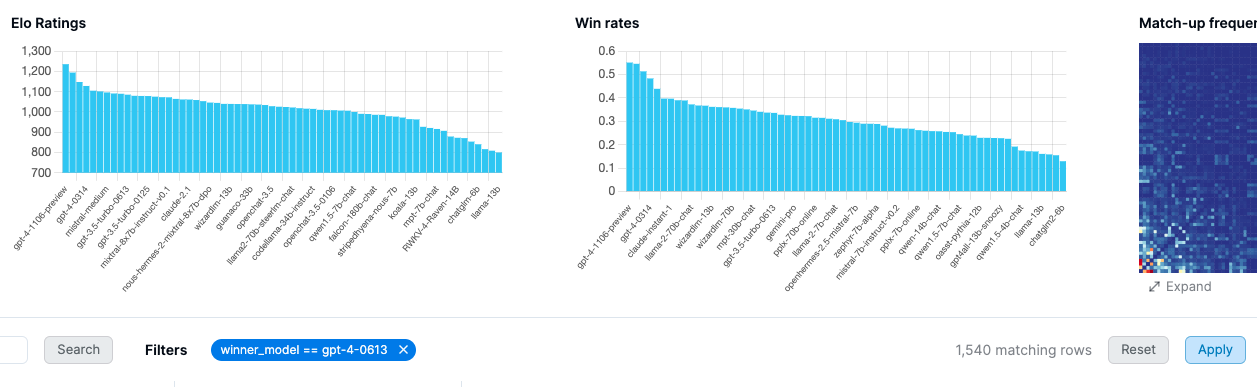
Filter by other insights
You can click other insights to add filters to the Filters list. Then click Apply to launch the filtering.
Full-text search
In order to search for particular keywords, simply enter them in the Search field and click Search.

Public and private datasets
Public datasets are viewable to all visitors without the need to create an account.
To use the Airtrain Dataset Explorer on your own dataset, you need to sign up and upgrade to a Pro subscription.
Updated about 2 months ago